

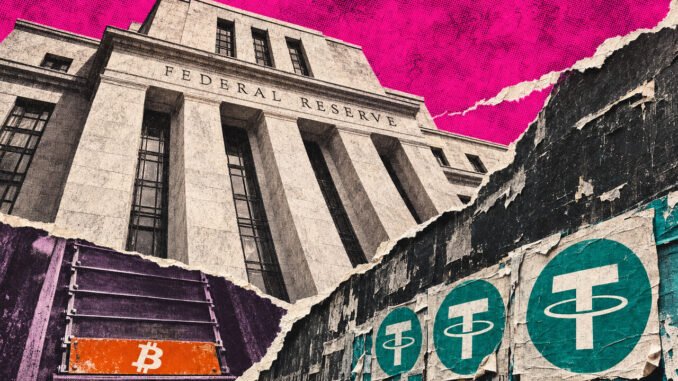

Bank reserve balances rose $67.5 billion between Oct. 28 and Nov. 4, according to the Federal Reserve’s Nov. 5 release, but the more abundant dollar liquidity is not automatically bullish for Bitcoin.
Over the same period, data provider DefiLlama tracked dollar-pegged stablecoin circulation falling by more than 5.7 billion units, or 1.91%.
The split leaves an incomplete picture for a Bitcoin recovery. Higher bank reserve balances would still need to translate into financing and purchases, so the measured token contraction adds a crypto-side observation to that test.
A Nov. 5 Treasury-cash analysis considered a possible December funding window using projected cash paths and the older Oct. 28 reserve baseline. The new release updates that starting point with a rebound in realized reserves.

Coinbase’s completed Nov. 5 daily BTC-USD candle closed at $75,969.06, down 5.54% from $80,428.31 on Nov. 4. That close-to-close fall followed the dated reserve observation, putting the price move outside the bank-balance comparison window.
Bank reserves rose as token supply contracted
The Fed’s H.4.1 release puts Nov. 4 reserve balances at $2.96 trillion. Over the preceding week, the Treasury General Account, the government’s account at the Fed, fell $79.4 billion to $936.2 billion.
Treasury payments move balances into depository institutions’ accounts, increasing reserves all else equal, while receipts flowing into Treasury’s account work in the opposite direction.
The final reserve change also incorporates movements elsewhere on the Fed’s balance sheet. Total assets rose $2.5 billion, while other balance-sheet changes offset part of the effect of the Treasury-account drawdown.
Tether’s USDT series fell 3.65 billion units, accounting for 63.37% of that measured contraction, while USD Coin (USDC) circulation declined 383 million units, contributing 6.64%. Other tracked dollar-pegged tokens together contracted a net 1.73 billion units.
The issuer breakdown locates the largest measured change in USDT. Whether, and to what extent, issuer redemptions, bridge-accounting adjustments, reclassification, or coverage revisions contributed remains unquantified.
Bank reserves rise while tracked dollar-token units decline, with each series indexed to 100 on October 28OCT 28 = 10098100102Bank reserves102.33+$67.568bnDollar-token units98.09−5.769bn unitsOCT 28, 2026NOV 4, 2026Dated endpoints on an index. Underlying observation times differ.
Indexed bank reserves and dollar-token units, October 28 to November 4OCT 28 = 10098100102Bank reserves102.33 / +$67.568bnDollar-token units98.09 / −5.769bnOCT 28NOV 4Dated endpoints. Observation times differ.
Inspect the two liquidity signals
Inspect the two liquidity signalsReserve bridgeToken contraction
The Treasury-account drawdown and asset increase exceeded the final reserve rise because other balance-sheet changes offset them.
Waterfall from Treasury-account drawdown and Fed asset changes to reserve growthRESERVE ACCOUNTING BRIDGE / USD BILLIONS+79.384+2.510−14.326*+67.568TGA drawdownFed assetsOther offsetsReserve rise*Derived net offset reconciles the three reported changes.
Reported Treasury drawdown and asset increase, derived other offsets and reported reserve increaseRESERVE BRIDGE / USD BILLIONSTGA drawdown+79.384Fed assets+2.510Other offsets*−14.326Reserve rise+67.568*Derived net offset reconcilesthe three reported changes.
USDT accounts for 63.37% of the measured decline in tracked dollar-pegged circulating units.
USDT accounts for 63.37 percent of the measured dollar-pegged token-unit contraction5.769 BILLION TOKEN-UNIT DECLINEUSDT63.37%3.655bn unitsUSDC6.64%0.383bn unitsOther, net29.99%1.730bn unitsAll three segments contribute to the measured contraction.
Composition of the token-unit decline, with USDT, USDC and the net remainder5.769bn TOKEN-UNIT DECLINEUSDT63.37%3.655 billion unitsUSDC6.64%0.383 billion unitsOther, net29.99%1.730 billion unitsShares of the measured unit contraction.
The two measures moved in opposite directions across these calendar labels.
Calendar labels align, underlying collection times differ. Lines join two endpoints without describing a daily path. The index compares percentage changes across different measures. The token series uses circulating units in the dollar-pegged category. These observations leave Bitcoin buyer identity and the transmission into demand unmeasured.
The Bitcoin recovery case still needs demand evidence
Reserves are banks’ settlement balances at the Fed, while stablecoin circulation measures the tracked stock of dollar-pegged tokens.
DefiLlama’s selected dates carry midnight UTC labels, while the Fed reports Wednesday levels. The comparison aligns calendar labels while leaving the underlying collection times unsynchronized.
For a liquidity-led recovery thesis, further evidence needs to connect reserve balances with financing and buying. A broader token supply could add evidence about crypto-native dollar availability, while proof of Bitcoin demand would still require its own observations.
Neither supply series resolves the cause of the subsequent selloff, and delayed liquidity effects remain possible. The observed divergence leaves the bank-to-Bitcoin demand channel open.



Be the first to comment